High attrition risk
Cardiovascular toxicity is one of the main reasons candidates are discontinued, directly affecting whether a programme can move forward.
For drug development and chemical safety assessment, VasoPT delivers an AI-driven, visual phenomics workflow for vascular toxicity — from live vascular imaging and automated interpretation to risk-graded reporting, producing quantifiable, comparable and decision-ready evidence in one standardized process.
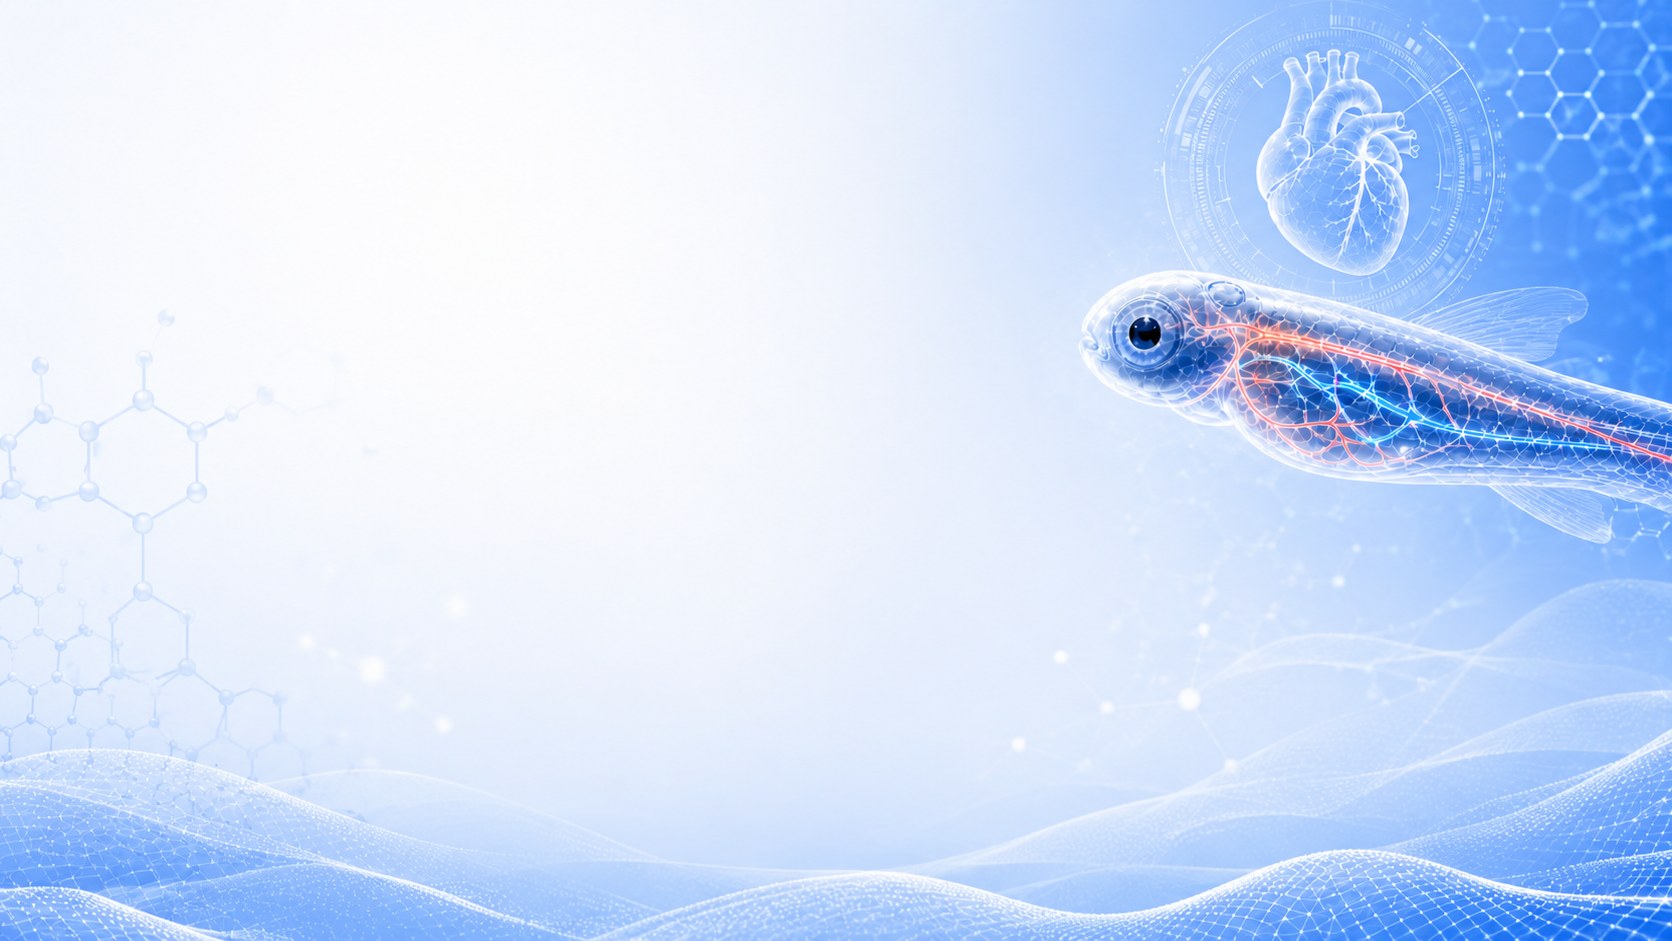
Cardiovascular toxicity is a major reason candidates fail. The later it is found, the higher the cost — and it usually appears as complex, multi-organ effects.
Cardiovascular toxicity is one of the main reasons candidates are discontinued, directly affecting whether a programme can move forward.
Safety issues found late in development sharply increase R&D cost and leave far less room to manoeuvre.
Effects span the heart, vasculature, nervous system and development; no single endpoint captures the real risk.
Early safety signals improve decision quality and concentrate resources on the candidates most likely to succeed.
In vitro models, isolated organs, animal studies and computational prediction each have strengths — yet between "whole vascular network" and "high-throughput screening" there has long been no early-stage method that delivers both.
hERG, iPSC-CMs, endothelial cells
Aortic rings, isolated hearts, tissue models
Rodents, dogs, zebrafish
QSAR, PBPK, machine learning
No early, rapid screening method that covers both the whole vascular network and high-throughput detection VasoPT was designed to fill exactly this gap: reading the whole-organism vascular phenotype in vivo and using AI to turn morphological change into comparable numbers.
Built for early screening in drug development and chemical safety, VasoPT centres on morphological phenomics: it converts changes in the living vascular network into structured metrics that support rapid identification, quantitative assessment and prioritization of candidates.
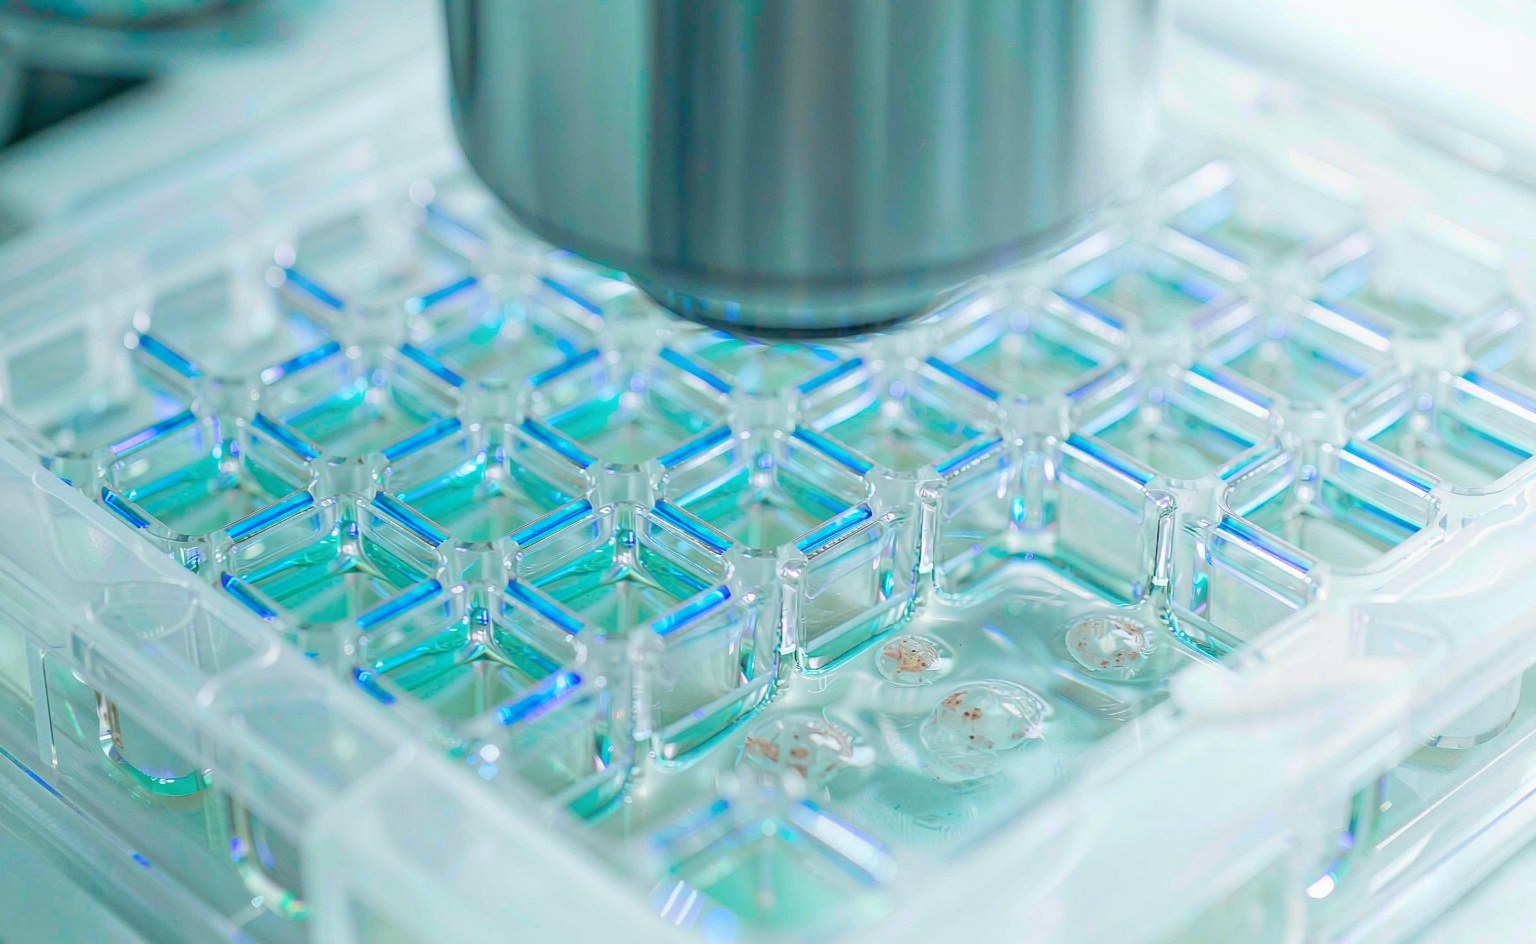 High-content imaging · 96-well
Three steps form one loop: imaging is the entry point, interpretation the core, grading the output.
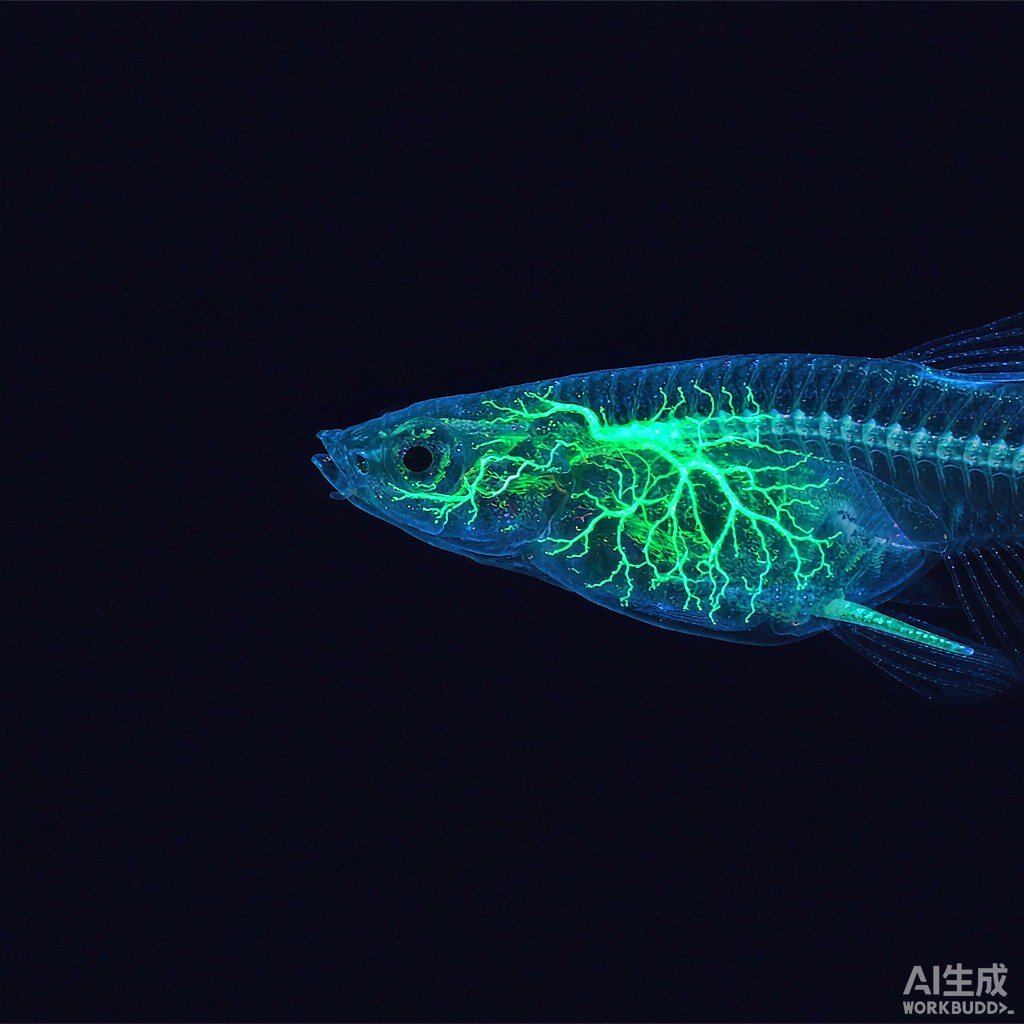
Vascular-fluorescent zebrafish embryos and larvae are imaged on a high-content system to capture the complete vascular network, preserving spatial structure and regional differences.
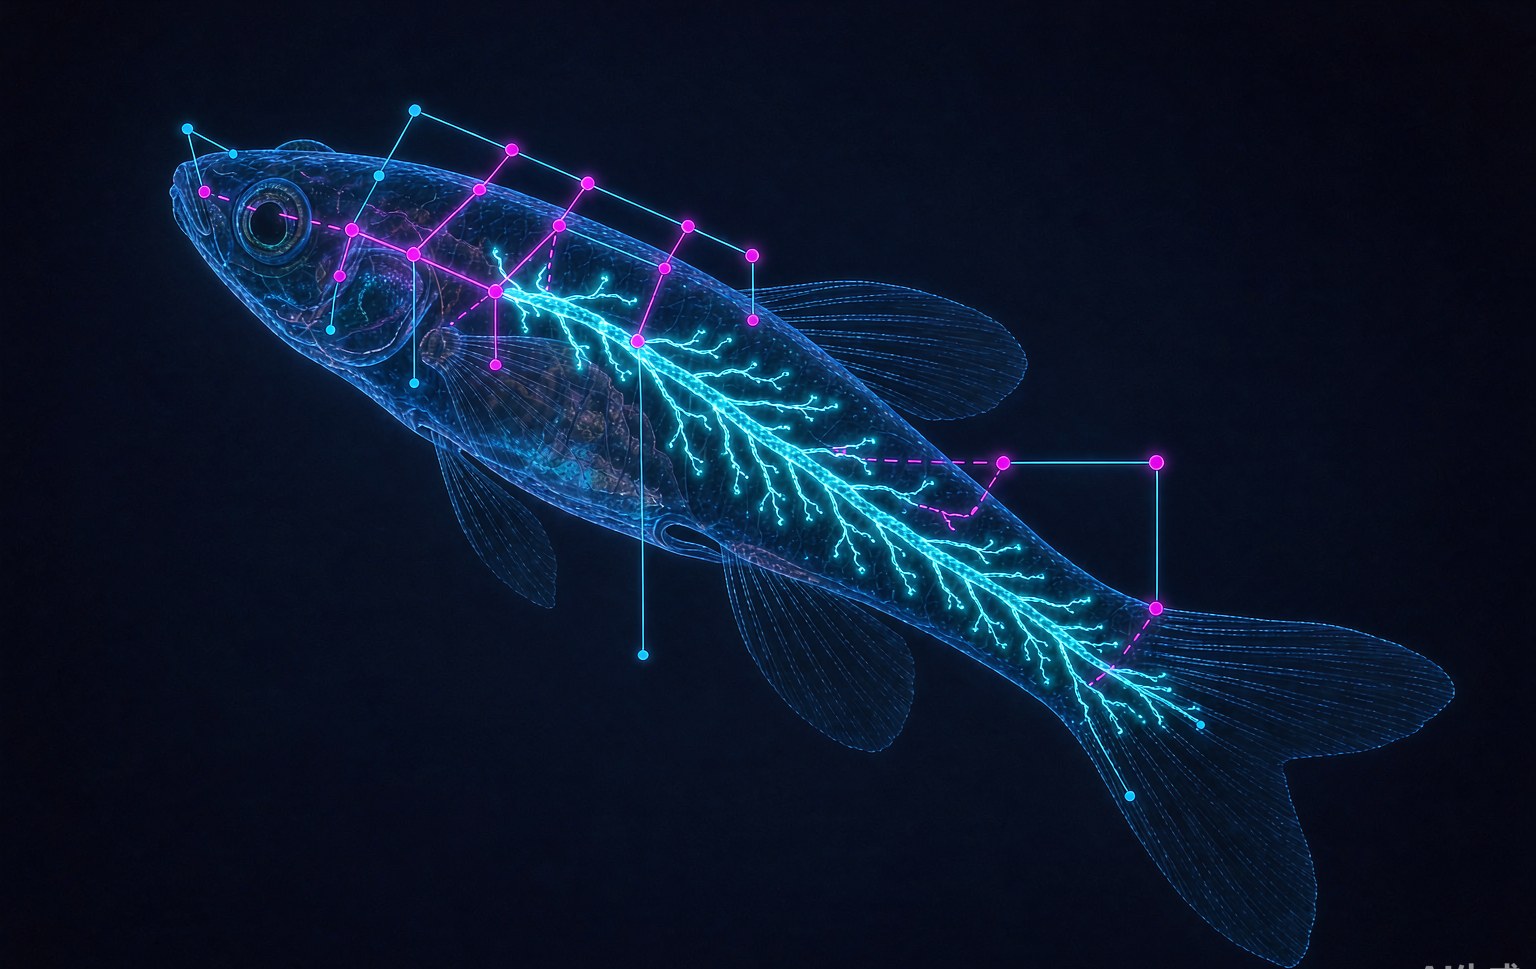
Automatically identifies vessel regions and key structural boundaries and extracts branching, density, length, diameter and regional injury parameters — turning morphology into computable objects.
Multi-dimensional metrics are combined into a toxicity score; dose–response trends yield low / intermediate / high risk grades and a watch list, delivered as a readable report.
The difference is the level of assessment: from single-endpoint readouts to whole vascular phenotype; from scattered results to a comparable metric matrix with unified grading.
| Dimension | Common methods | VasoPT |
|---|---|---|
| Level of assessment | Mostly single endpoints or local readouts | Whole vascular phenotype assessment |
| Result presentation | Scattered results, limited intuitiveness | Image visualization + regional injury localization |
| Data output | Limited metrics, weak cross-comparison | Multi-dimensional metric matrix and composite score |
| Analysis | Heavily dependent on manual reading | AI recognition and standardized analysis |
| Decision support | Hard to reach a consistent grading conclusion | Supports dose–response analysis and risk grading |
From small-molecule libraries to nanomaterials to environmental chemicals — one method, different safety questions.
Cardiovascular toxicity assessment and risk stratification of 500 small molecules: identify potential risk signals and output a low / intermediate / high risk list.
Black phosphorus nanomaterials, quantum dots and related nano drug-delivery systems: focus on vascular developmental abnormalities, local structural injury and dose-related risk.
150 chemicals of environmental health concern: clustering into six vascular injury phenotypes, with a composite risk ranking.
Tell us your compound type, sample scale and assessment goal, and we will propose the matching test design and deliverables.